
About Mixpanel
Overview
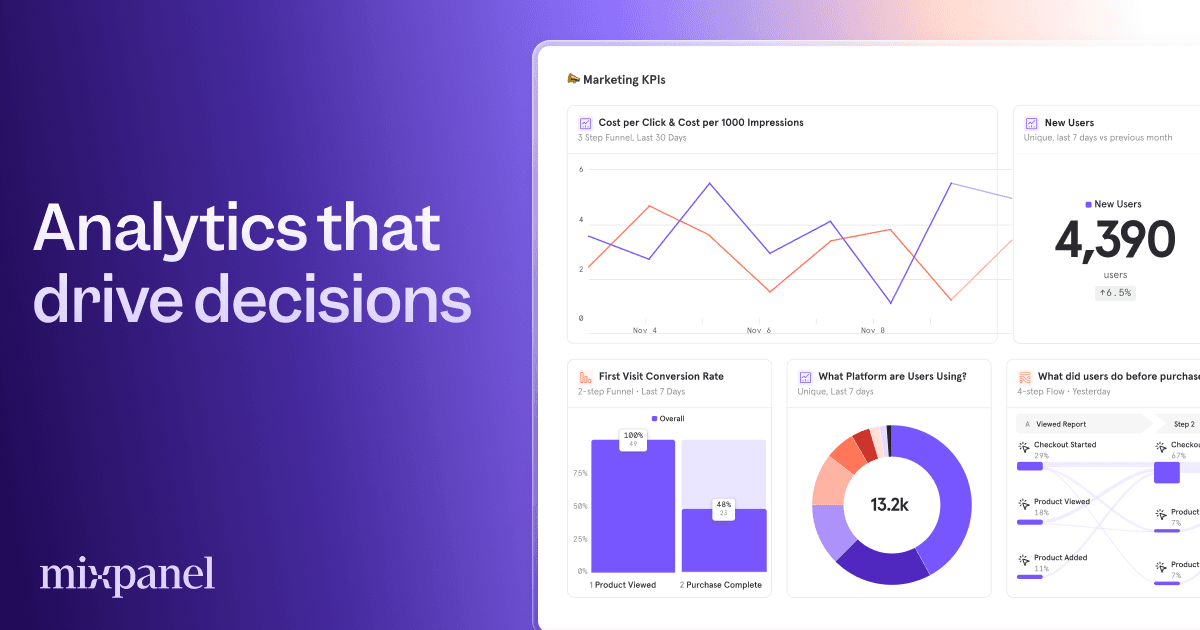
Mixpanel is a product analytics platform built for product, engineering, marketing, and data teams. It helps teams understand what users actually do by tracking events, building funnels, analyzing retention, and segmenting audiences.
Mixpanel integrates AI throughout the platform to surface insights, diagnose problems, and recommend next actions. It connects with data warehouses like Snowflake, BigQuery, and Redshift to unify product and backend data in one place.
Key Benefits
- Explore user behavior, conversion trends, and retention patterns in seconds without requiring a data team.
- Mixpanel AI proactively surfaces the "why" behind numbers and recommends what to build next.
- Session replays are tied directly to analytics so teams can go from seeing a drop-off to watching the session in seconds.
- Connect the tech stack from BigQuery to Segment to reverse ETL tools so data lives where it is needed.
- Run A/B tests against real product metrics and manage feature flags from the same tool.
- Map key metrics and their drivers using Metric Trees so every team knows which levers to pull.
How It Works
Teams send event data from their app or website into Mixpanel using SDKs, APIs, or warehouse connectors. They then build reports using the drag-and-drop interface — funnels, retention curves, flows, and session replays — and Mixpanel AI surfaces anomalies and insights automatically.
Use Cases
- Product managers track feature adoption and drop-off points using funnels and retention reports.
- Growth engineers run A/B experiments with feature flags and measure results against product metrics.
- Marketing teams attribute conversions across channels using multi-touch attribution reports.
- Data analysts unify product event data with backend data from Snowflake or BigQuery for cross-functional analysis.
- Engineering teams debug user issues by watching session replays tied to specific funnel drop-off steps.
- Executive teams monitor company KPIs through Metric Trees that map high-level metrics to their drivers.
Why Choose This Product
Mixpanel is best suited for product-led companies that need self-serve analytics without a dedicated data team. The free tier supports unlimited seats and up to 1 million events per month, while enterprise offers dedicated account support, security controls, and up to 1 trillion events.
Mixpanel Pros & Cons
- Free tier with unlimited seats and up to 1M events/month
- Session replays tied directly to analytics data
- AI proactively surfaces insights and anomalies
- Integrates with Snowflake, BigQuery, Redshift data warehouses
- A/B testing and feature flags in a single tool
- Growth and Enterprise pricing requires contacting sales for exact amounts
- Session replay limits are relatively low on free tier (10K/month)
- Anomaly detection only available in Enterprise plan
- Experiment reporting and feature flags are add-ons or Enterprise-only
Key Features
Funnels & Retention
Track user progression through funnels and analyze retention cohorts to understand where users drop off and return.
Mixpanel AI Insights
AI proactively surfaces insights, diagnoses problems, and recommends next actions based on your product data.
Session Replay
Watch recorded user sessions tied directly to analytics events to see exactly what happened at drop-off points.
A/B Experiments
Run experiments with feature flags and A/B tests measured against real product metrics from the same platform.
Metric Trees
Build a living map of KPIs and their drivers so every team knows which levers affect business outcomes.
Warehouse Connectors
Sync data from Snowflake, BigQuery, and Redshift to unify product and backend data for analysis.
Multi-Touch Attribution
Attribute conversions across marketing channels with multi-touch attribution reports on Growth and Enterprise plans.
Monitoring & Alerts
Set up monitoring alerts per project on paid plans to get notified of anomalies and metric changes.
Security & Compliance
SOC 2 Type II compliant with GDPR and CCPA support, US or EU data residency, and SAML-based SSO on Enterprise.
Root Cause Analysis
Identify the root cause of metric changes with anomaly detection and correlation analysis on Enterprise plans.
Mixpanel Pricing
View full pricing →- Core funnels & retention analysis
- Up to 1M events/month
- 10K session replays/month
- Self-serve analytics
- Unlimited seats
- 5 saved reports per seat
- Insights, funnels, retention & flows reports
- Funnels, cohorts & unlimited saved metrics
- Up to 20M events/month
- Up to 500K session replays/month
- Behavioral cohorts & multi-touch attribution
- First 1M events free
- 20K free session replays/month
- Funnels, cohorts & Metric Trees
- Up to 1T events/month
- Customizable session replay volumes
- Anomaly detection & root cause analysis
- Feature flags & experimentation
- Security controls & priority support
| Feature | Free Free/mo | Growth Free/mo | Enterprise Custom |
|---|---|---|---|
| Core funnels & retention analysis | |||
| Up to 1M events/month | |||
| 10K session replays/month | |||
| Self-serve analytics | |||
| Unlimited seats | |||
| 5 saved reports per seat | |||
| Insights, funnels, retention & flows reports | |||
| Funnels, cohorts & unlimited saved metrics | |||
| Up to 20M events/month | |||
| Up to 500K session replays/month | |||
| Behavioral cohorts & multi-touch attribution | |||
| First 1M events free | |||
| 20K free session replays/month | |||
| Funnels, cohorts & Metric Trees | |||
| Up to 1T events/month | |||
| Customizable session replay volumes | |||
| Anomaly detection & root cause analysis | |||
| Feature flags & experimentation | |||
| Security controls & priority support |
Pricing extracted from the product website and may change. Check the source for current details.
Frequently asked questions about Mixpanel
What is an event?
An event is any user action or occurrence tracked in Mixpanel, such as a page view, button click, or purchase. Events are the building blocks of Mixpanel's analytics reports.
How does pricing work?
Mixpanel offers a Free plan with up to 1M events per month, a Growth plan starting with 1M free events and up to 20M events per month, and an Enterprise plan with custom pricing for up to 1T events. Volume discounts are available.
How can I estimate my event volume?
Mixpanel provides tools and documentation to help estimate event volume based on the number of users and actions tracked in your product. The pricing page also shows the event limits for each plan.
We're a startup. Do you have any discounts?
Early-stage companies founded less than 5 years ago with up to $8M in total funding can receive their first year free on the Startup Plan, provided they have not redeemed any other offers.
Is Mixpanel free?
Mixpanel offers a free plan with optional paid upgrades. See the pricing section for what's included in each tier.
How much does Mixpanel cost?
Mixpanel offers the following plans: Free, Growth, Enterprise. See the pricing section for what's included in each tier and any per-seat or usage-based costs.
How Mixpanel compares
MixpanelThis | ||||
|---|---|---|---|---|
| Starting price | Free | Free | Free | Free |
| Pricing model | Freemium | Freemium | Freemium | Freemium |
| Platforms | Web | Web | — | Web |
| Top features |
|
|
|
|
| Rating | — | — | — | — |


