About Safari Web Development Tools
Overview
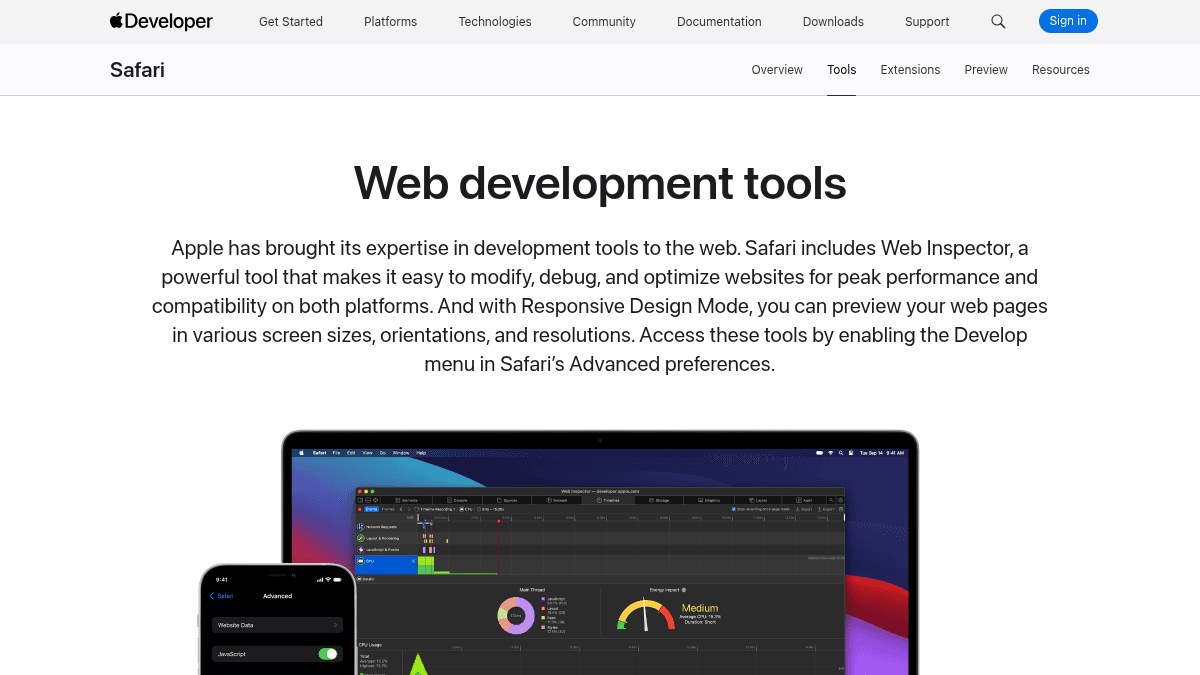
Safari's built-in web development tools give developers a full debugging and optimization suite inside the browser. These tools include Web Inspector and Responsive Design Mode, accessed by enabling the Develop menu in Safari's Advanced preferences. Apple designed them for anyone building websites that need to work across iOS, iPadOS, and macOS.
Unlike standalone browser DevTools in other engines, Safari's tools are powered by WebKit and integrate directly with the Apple ecosystem. The unified interface puts each core function in a separate tab — Elements, Console, Sources, Network, Timelines, Storage, Graphics, Layers, and Audit — that users can rearrange to fit their workflow.
Key Benefits
- Web Inspector provides access to nine specialized tabs covering every aspect of page inspection, from markup editing to memory profiling.
- Responsive Design Mode lets users preview web pages across various screen sizes, orientations, and resolutions, including iPad Split View.
- The Edit Styles widget supports over 150 of the most common CSS properties for quick visual tweaks without editing source files.
- Timelines plots network requests, layout and rendering, JavaScript events, memory, and CPU impact on a single timeline for performance analysis.
- The Layers tool visualizes compositing layers in 3D to help identify unexpected memory consumption or excessive repaints.
- Audit certifies that common code and accessibility errors are addressed and confirms pages follow modern design guidelines.
How It Works
You enable the Develop menu in Safari's Advanced preferences, then open Web Inspector on any web page. From the Elements tab you click nodes in the markup tree to inspect and edit HTML and CSS in place, or switch to the Console tab to type JavaScript commands interactively. You drag window edges or click a device preset in Responsive Design Mode to resize the viewport, and toggle between portrait and landscape orientations — including iPad Split View.
Use Cases
- Front-end web developers inspect DOM nodes and edit CSS properties live using the Elements tab and its style widgets.
- Performance engineers use Timelines to analyze network requests, rendering, JavaScript execution, memory, and CPU impact frame by frame.
- Quality assurance testers run the Audit tab to catch common code errors and accessibility issues before a site ships.
- Responsive design specialists use Responsive Design Mode to test layouts at custom viewport sizes, device presets, and user agents.
- JavaScript developers step through script execution with the Sources debugger, using data type and code highlights to troubleshoot logic.
- Graphics and animation designers preview HTML5 canvas, JavaScript animations, CSS animations, and CSS transitions in the Graphics tab.
Why Choose This Product
Safari's built-in web development tools are best suited for developers building and debugging websites for Apple platforms. They are available at no cost to anyone running Safari on macOS. The tools require enabling the Develop menu manually and are limited to the WebKit rendering engine, meaning pages tested here should also be verified in other browsers.
Safari Web Development Tools Pros & Cons
- Nine specialized Web Inspector tabs cover all major debugging needs
- Responsive Design Mode supports iPad Split View and custom user agents
- Audit tool checks code quality and accessibility automatically
- No cost — included with Safari on macOS
- Layers visualization in 3D helps debug compositing issues
Key Features
DOM inspection
Inspect DOM nodes from a fully editable markup tree with sidebars for styles and detailed properties.
Interactive console
Type JavaScript commands interactively and view logs, errors, and warnings emitted from a webpage.
Source debugging
Browse all page resources — documents, images, scripts, stylesheets — and debug with data type and code highlights.
Network analysis
Review every network request's response, status, and timing to evaluate loading performance.
Timeline recording
Plot network requests, layout, rendering, JavaScript events, memory, and CPU impact on a single timeline.
Storage viewer
Inspect application cache, cookies, databases, indexed databases, local storage, and session storage.
Animation preview
Preview animation keyframes from HTML5 canvas, JavaScript, CSS animations, and CSS transitions.
Layer visualization
Visualize compositing layers in 3D to identify unexpected memory consumption or excessive repaints.
Accessibility audits
Run audits to catch common code errors, accessibility issues, and confirm modern design guidelines.
Responsive preview
Resize viewport to preset device sizes, custom dimensions, and user agents with orientation toggling.