
About Chrome DevTools
Overview
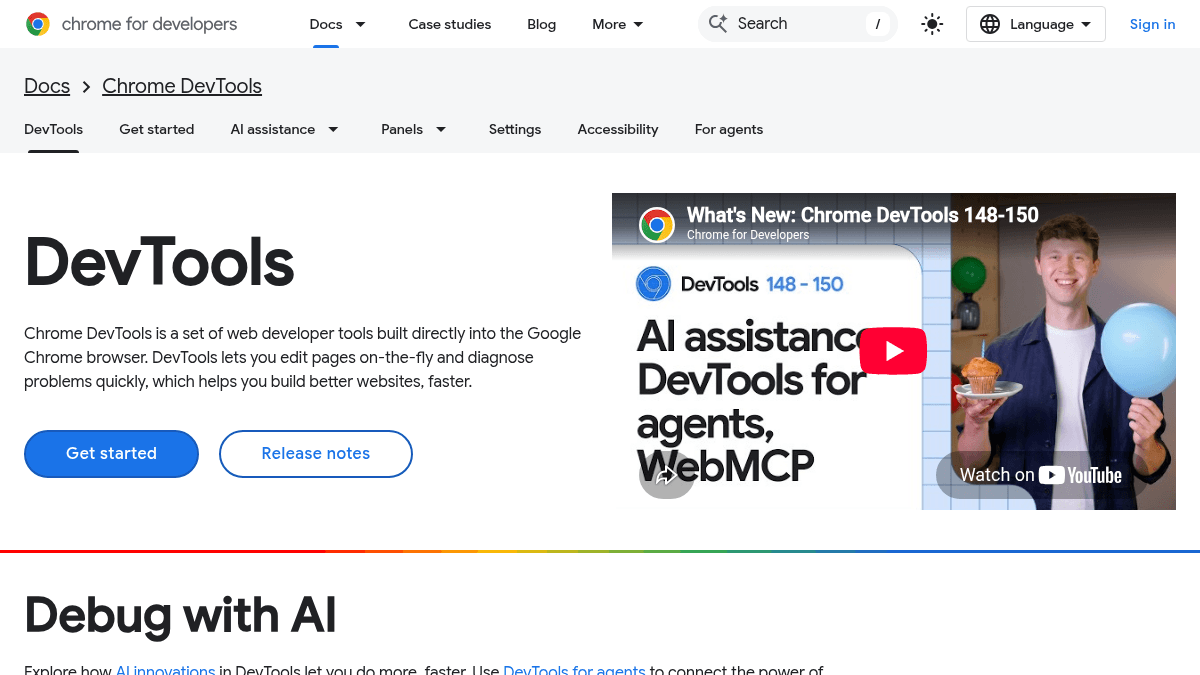
Chrome DevTools is a set of web developer tools built directly into the Google Chrome browser. It lets developers edit pages on the fly and diagnose problems quickly, which helps build better websites faster.
The toolset includes dedicated panels for inspecting HTML and CSS, debugging JavaScript, analyzing network requests, measuring performance, auditing accessibility, and optimizing page loads. Unlike third-party debugging tools, DevTools ships with every Chrome installation at no cost and integrates deeply with the browser runtime, giving developers direct access to internal state that external tools cannot reach.
Key Benefits
- Edit page HTML and CSS in real time from the Elements panel without reloading the page.
- Debug JavaScript directly in the Sources panel with breakpoints, watch expressions, and step-through execution.
- Analyze network requests and responses, and overwrite them on the fly from the Network panel.
- Measure Core Web Vitals — LCP, CLS, and INP — using the Performance panel and get tailored advice from Gemini.
- Run automated Lighthouse audits that evaluate accessibility, SEO, best practices, and agentic browsing.
- Emulate responsive layouts, location-aware APIs, and varied CPU or network speeds without external devices.
How It Works
You open DevTools by pressing F12 or right-clicking any page element and selecting Inspect. The interface appears as a docked panel or separate window organized into tabs — Elements, Console, Sources, Network, Performance, Memory, Application, Security, Lighthouse, and more. You select the panel that matches the task at hand: edit styles in Elements, run JavaScript expressions in Console, or record a performance trace with the Performance recorder.
Use Cases
- Frontend developers inspect and tweak CSS layout, font sizing, and responsive breakpoints directly in the Elements panel.
- JavaScript engineers set breakpoints in Sources, inspect call stacks, and fix runtime errors without leaving the browser.
- Site reliability engineers use the Network panel to throttle bandwidth, inspect API payloads, and replay modified requests.
- Accessibility specialists audit contrast ratios, ARIA attributes, and keyboard navigation using the Lighthouse report and the dedicated Accessibility panel.
- Performance engineers record page interactions in the Performance panel, identify layout shifts and long tasks, and correlate them with Core Web Vitals metrics.
- QA engineers write automated end-to-end flows with Puppeteer or connect coding agents to the DevTools MCP server to verify behavior programmatically.
Why Choose This Product
Chrome DevTools is suited for any web developer or QA engineer already using Google Chrome, since it requires no installation or separate configuration. Its deep integration with the browser gives it unique capabilities such as live style editing, network interception, and direct debugger attachment that standalone tools cannot offer. The toolset is free and open source, and there is no paid tier — all features ship with every Chrome release.
Chrome DevTools Pros & Cons
- Built into Google Chrome with zero install
- Live HTML/CSS editing without page reload
- Performance panel measures Core Web Vitals directly
- Free and open source with no paid tier
- Integrates with AI via Gemini and coding agents via MCP server
Key Features
Live Style Editing
Inspect, edit, and debug live HTML and CSS in real time from the Elements panel.
Console & AI Help
Execute JavaScript expressions, view console errors, and receive AI-suggested fixes and code hints.
JavaScript Debugger
Set breakpoints, step through code, and inspect scope in the Sources panel.
Network Inspection
Analyze, filter, and overwrite network requests and responses on the fly.
Performance Profiling
Record runtime performance traces and measure Core Web Vitals (LCP, CLS, INP) with Gemini-tailored advice.
Lighthouse Audits
Run automated audits for accessibility, SEO, best practices, and progressive web app readiness.
Device Emulation
Emulate responsive viewports, geolocation, and CPU or network throttling without external hardware.
Storage & Data Tools
Inspect cookies, local storage, session storage, IndexedDB, and cache storage.
Agent Integration
Enable coding agents to inspect network activity, record traces, and troubleshoot applications via the MCP server.
CSS Analysis Tools
Examine CSS coverage, compute unused rules, and visualize layer stacking order.
Chrome DevTools Pricing
Pricing extracted from the product website and may change. Check the source for current details.