About Sentry
Overview
Sentry is an application monitoring platform that helps developers find and fix errors, performance slowdowns, and crashes. It connects errors, logs, session replays, spans, profiles, and metrics under a single trace so teams can go from issue to context to fix without switching tools.
Sentry targets software teams of all sizes, from individual developers to large enterprises like Disney, Atlassian, and GitHub. Unlike separate error tracking and APM tools, Sentry unifies debugging signals in one platform and adds AI-assisted root cause analysis through Seer.
Key Benefits
- Drop in the SDK with five lines of code — no agents to install, no performance surprises.
- See errors, logs, replays, spans, profiles, and metrics all connected by the same trace.
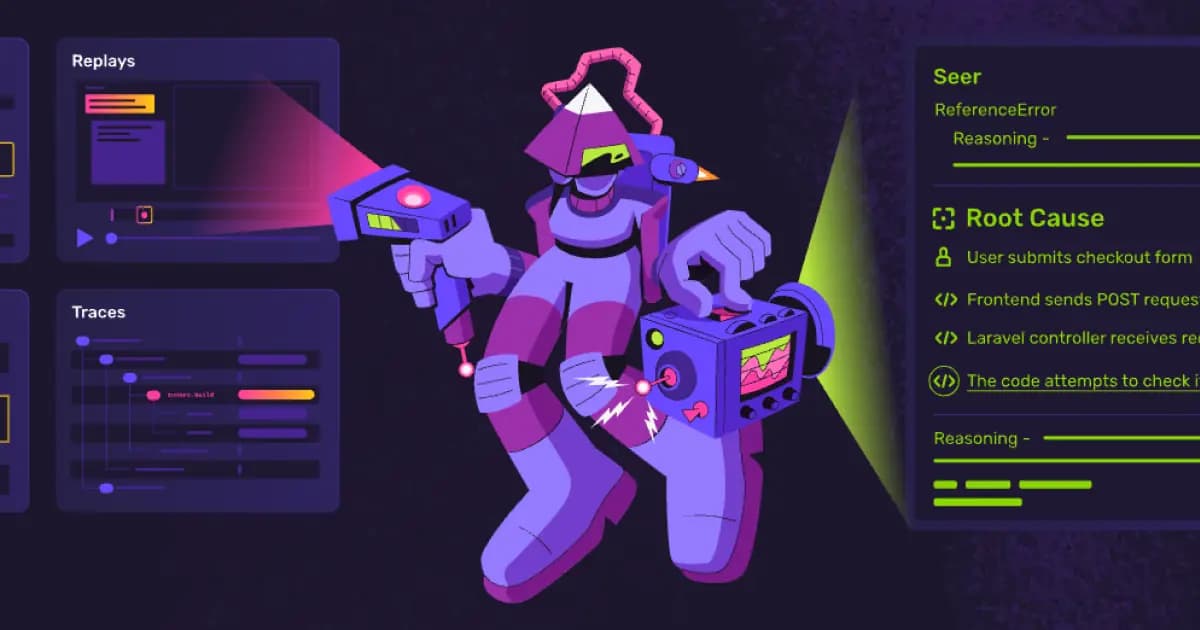
- Automatically root-cause any issue with Seer, an AI debugger that analyzes logs, commits, traces, and stack traces.
- Predict and prevent errors before they reach production using AI code review.
- Get full context for every fix from dev to prod through integrations with GitHub, Slack, Jira, Linear, and coding agents via the Sentry MCP server.
- Map every incident to the release, pull request, and owner automatically.
How It Works
You add the Sentry SDK to your application in five lines of code. Sentry automatically captures errors, performance traces, session replays, and logs under a single distributed trace. When an issue surfaces, you open the Sentry dashboard, click into the event, and see the stack trace, related logs, affected users, replay video, code commits, and the owning pull request — all in one view. The Seer AI agent can then generate a merge-ready fix for the broken code.
Use Cases
- Web and full-stack development teams debug frontend and backend errors with stack traces, console logs, and session replays connected in a single view.
- Mobile app developers track crash reports with device context, breadcrumbs, and release health data to reproduce and fix issues.
- Game studios monitor crash rates and performance profiles across live player sessions to ship stable builds.
- AI and ML engineering teams observe LLM calls, agent traces, and latency to debug AI application behavior.
- Ecommerce teams catch slow queries, N+1s, and request timeouts before they degrade the customer checkout experience.
- DevOps and SRE teams monitor cron job failures, uptime alerts, and release-level incident maps to automate incident response.
Why Choose This Product
Sentry is best suited for development teams that want a single platform connecting errors, performance, logs, and replay data rather than stitching together separate tools. The free Developer tier supports one user with 5,000 errors and 50 session replays per month, making it accessible for individual developers and small projects. Larger teams should note that advanced AI debugging through Seer comes at additional cost, and pay-as-you-go rates apply above each plan's included base quota.
Key Features
Error Monitoring
Captures errors with full stack traces, breadcrumbs, and context across any language or framework.
Log Management
Ingests logs alongside errors and traces with 5GB included on the Developer tier and pay-as-you-go above.
Session Replay
Records user sessions as video-like replays to see exactly what happened before an error.
Distributed Tracing
Connects errors, logs, replays, and metrics under a single trace to follow requests across services.
Continuous Profiling
Samples production code runtime at $0.0315/hour to identify performance bottlenecks.
Seer AI Debugger
An AI debugger that analyzes logs, commits, traces, and stack traces to explain why code failed and generate merge-ready patches.
AI Code Review
Correlates pull requests against error and performance history to catch regressions before they ship.
Cron Monitoring
Tracks cron job executions and alerts on missed or failed schedules with one free monitor included.
Size Analysis
Analyzes JavaScript bundle sizes across 100 builds with unlimited build monitors on all paid tiers.
Uptime Monitoring
Checks endpoint availability with configurable alerts and one free uptime monitor included.
Sentry Pricing
View full pricing →- 1 user
- Unlimited projects
- 5k errors
- 5GB logs
- 5GB application metrics
- 5M spans
- Unlimited users
- 50k errors
- 5GB logs
- 5GB application metrics
- 5M spans
- 50 replays
- Unlimited users
- 50k errors
- 5GB logs
- 5GB application metrics
- 5M spans
- 50 replays
- Custom error volume
- Custom log volume
- Custom metrics volume
- SSO SAML2 and SCIM
- HIPAA and BAA support
- Dedicated technical account manager
| Feature | Developer Free/mo | Team $26/mo | Business $80/mo | Enterprise Custom |
|---|---|---|---|---|
| 1 user | ||||
| Unlimited projects | ||||
| 5k errors | ||||
| 5GB logs | ||||
| 5GB application metrics | ||||
| 5M spans | ||||
| Unlimited users | ||||
| 50k errors | ||||
| 50 replays | ||||
| Custom error volume | ||||
| Custom log volume | ||||
| Custom metrics volume | ||||
| SSO SAML2 and SCIM | ||||
| HIPAA and BAA support | ||||
| Dedicated technical account manager |
Pricing extracted from the product website and may change. Check the source for current details.