
About D3
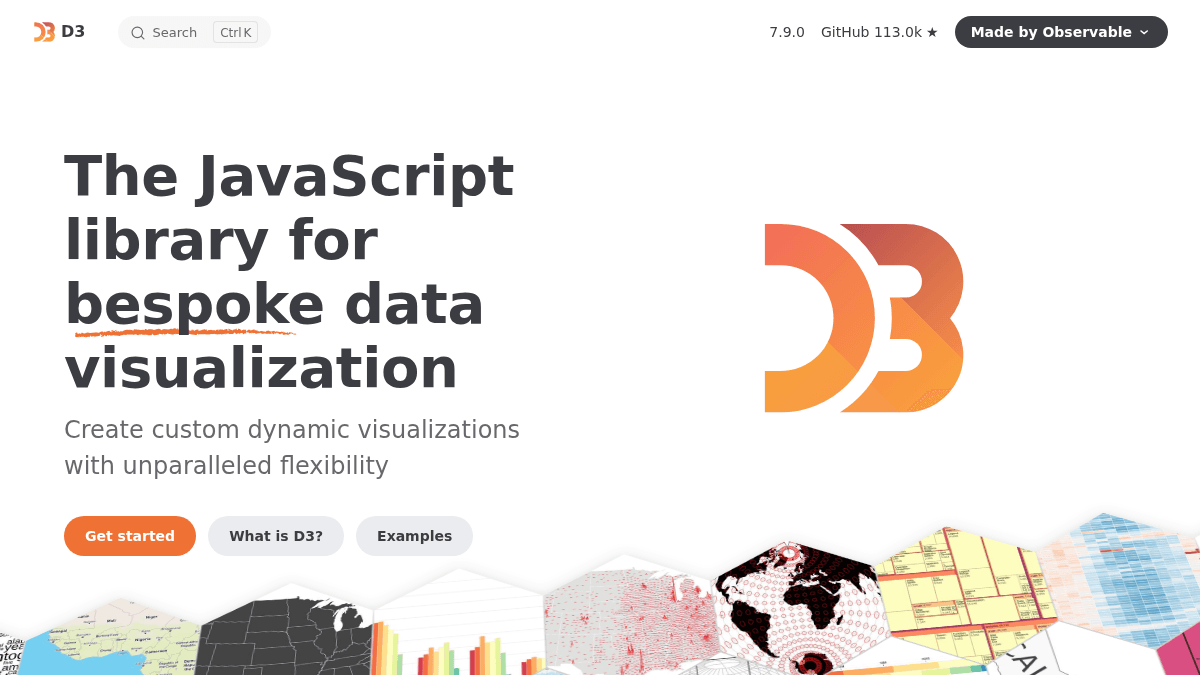
Overview D3 is the JavaScript library for creating bespoke data visualizations on the web. It binds data to the Document Object Model (DOM) and applies data-driven transformations to the document. The library is built for developers and data scientists who need full control over every visual aspect of their charts, maps, and interactive graphics. Unlike high-level charting libraries that offer pre-built chart types, D3 gives you direct access to the DOM and SVG, allowing unlimited customization. The library is maintained by Observable, the collaborative data analysis platform. Key Benefits Create and animate DOM elements directly from data without the overhead of a virtual DOM. Encode abstract data into visual values such as position, size, and color using scales, and explain position encodings with axes. Render geometric primitives including arcs, areas, curves, lines, links, pies, stacks, and symbols. Facilitate exploration with reusable interactive behaviors including panning, zooming, brushing, and dragging. Access a library of layout algorithms for treemaps, trees, force-directed graphs, Voronoi, contours, chords, and circle-packing. Support more spherical projections than any other library, with arbitrary aspects, adaptive sampling, and flexible clipping. How It Works You select DOM elements using D3 selections, then bind data to those elements. You use scales to map data values to visual variables like position and color, then draw shapes such as arcs, lines, or areas using the library's shape generators. You add interaction by attaching behaviors for panning, zooming, brushing, or dragging, and you lay out complex structures like treemaps or force-directed graphs using the built-in layout algorithms. Use Cases Data journalists and newsroom developers build interactive charts and maps for articles that need to stand out from standard chart templates. UX engineers at data-forward companies create custom dashboard visualizations that no off-the-shelf charting library can produce. Academic researchers and data scientists publish reproducible, interactive figures for papers and presentations. Front-end developers embed custom animated graphics into web applications, from network diagrams to geographic maps with multiple projections. Observable notebook users combine D3 with Observable's reactive runtime to build collaborative data apps and explorable explanations. Why Choose This Product D3 is best suited for developers who need complete creative freedom over their data visualizations and are comfortable working directly with SVG, DOM, and JavaScript. It offers unmatched flexibility compared to high-level charting libraries, but this comes with a steeper learning curve. The library is free and open source under the ISC license.
D3 Pros & Cons
- Unmatched flexibility for custom visualizations
- Free and open source under ISC license
- Rich set of layout algorithms for complex data
- Extensive geographic map support with many projections
- Built and maintained by Observable
Key Features
Selections and transitions
Create, update, and animate DOM elements based on data without the overhead of a virtual DOM
Scales and axes
Encode abstract data into visual values such as position, size, and color, and explain position encodings with axes
Shape generators
Render arcs, areas, curves, lines, links, pies, stacks, symbols, and any geometric primitive needed for data visualization
Interaction behaviors
Facilitate exploration with reusable interactive behaviors including panning, zooming, brushing, and dragging
Layout algorithms
Access a library of layout algorithms for treemaps, trees, force-directed graphs, Voronoi, contours, chords, and circle-packing
Geographic maps
Support more spherical projections than any other library, with arbitrary aspects, adaptive sampling, and flexible clipping
Data utilities
Parse CSV data, handle localized date parsing and formatting, work with color spaces, calendar math, and statistics
Observable Plot
A high-level API for quick charts built on top of D3, also developed by the D3 team
D3 Pricing
- Create custom dynamic visualizations with unparalleled flexibility
- Access to selections, transitions, scales, axes, and shape generators
- Use interactive behaviors like panning, zooming, brushing, and dragging
- Leverage layout algorithms for treemaps, trees, and force-directed graphs
- Utilize geographic maps with multiple spherical projections
- Parse CSV, format dates, work with color spaces and statistics
Pricing extracted from the product website and may change. Check the source for current details.
Frequently asked questions about D3
Is D3 free?
Yes — D3 is free to use. See the pricing section for any optional add-ons.
How much does D3 cost?
D3 offers the following plans: Free. See the pricing section for what's included in each tier and any per-seat or usage-based costs.
What platforms does D3 support?
D3 is available on: Web.