
About Data Viz Project
Overview
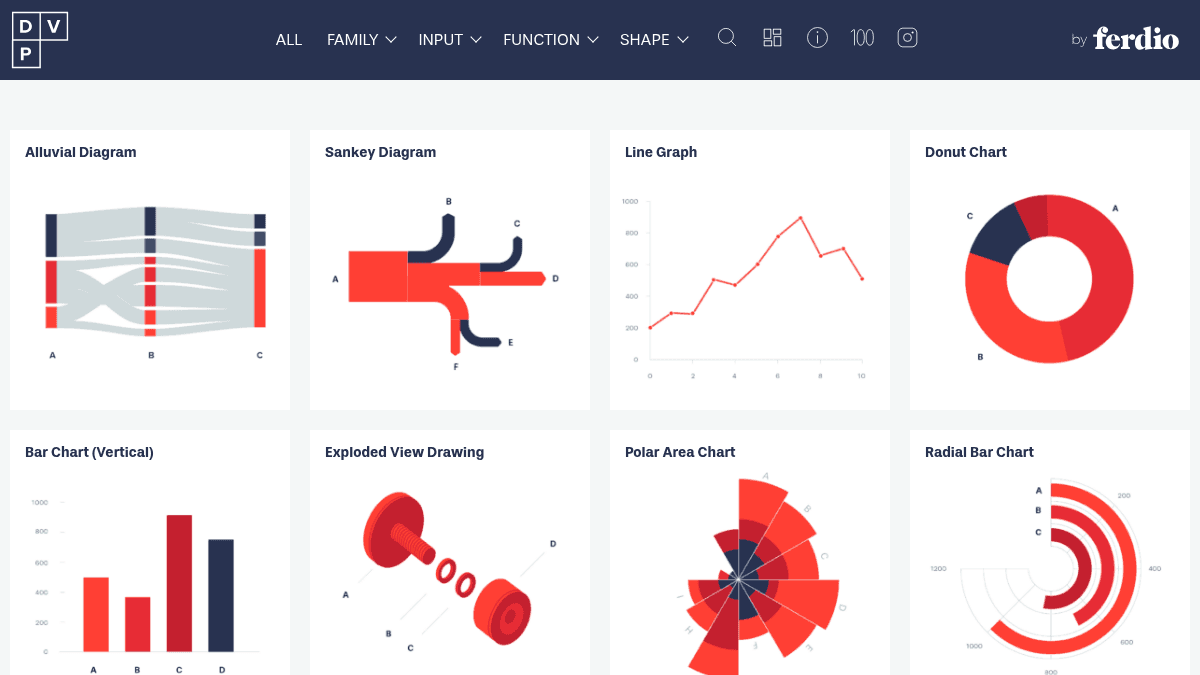
Data Viz Project is a searchable collection of over 100 data visualization types maintained by Ferdio, a data visualization agency. It helps designers, analysts, and researchers find the right chart type for their data and get inspired by real visual examples.
Unlike generic chart libraries or documentation sites, the project organizes visualizations by input type, function, shape, and purpose — letting users filter by comparison, correlation, distribution, geolocation, part-to-whole, and trend-over-time. Each visualization type has its own dedicated page with a description and example.
Key Benefits
- Browse more than 100 distinct visualization types from a single directory.
- Filter visualizations by input, family, function, and shape to match your data needs.
- See one dataset rendered in 100 different chart formats for direct comparison.
- Access free inspiration for infographic and dashboard design from a professional agency.
- Request custom-designed visualizations by contacting the Ferdio team.
How It Works
You open the site and browse the full grid of visualization types, or use the search bar to find a specific chart. You filter results by family (e.g. Chart, Diagram, Geospatial, Plot, Table) and by function (e.g. Comparison, Correlation, Distribution, Trend over time). Clicking any visualization opens its dedicated page showing a rendered example and a short description.
Use Cases
- Data journalists researching the best chart format for a story dataset.
- UX and dashboard designers looking for less common visualization types like chord diagrams or hexbin plots.
- Students learning data visualization who need a structured reference of chart families.
- Marketing and presentation teams searching for visually compelling ways to present survey or business data.
- Data analysts comparing shape options — radial, circular, linear, grid-based — before building a report.
Why Choose This Product
Data Viz Project is best suited for anyone who needs a clear, searchable reference of visualization types rather than a tool that generates charts itself. It does not offer chart-building or integration features — it is purely an inspiration and reference site, supplemented by the professional design services of Ferdio for custom projects.
Data Viz Project Pros & Cons
- 100+ visualization types in one directory
- Filterable by family, function, input, and shape
- Free to browse with no account required
- Shows one dataset rendered in 100 formats
- Backed by an experienced data viz agency
Key Features
100+ chart types
Over 100 distinct visualization types are listed, ranging from common bar charts to specialized formats like chord diagrams and bagplots.
Multi-dimensional filtering
Visualizations can be filtered by input type, family (Chart, Diagram, Geospatial, Plot, Table), function, and shape.
Single dataset demo
One reference dataset is rendered in 100 different chart formats for side-by-side comparison.
Dedicated type pages
Each visualization type has a dedicated page with example and description.
Custom design services
Ferdio provides professional custom infographic and data visualization design services on request.
Feedback submission
Users can send feedback or suggestions about the project through a contact link.
Data Viz Project Pricing
Pricing extracted from the product website and may change. Check the source for current details.
Frequently asked questions about Data Viz Project
How do I find the right visualization type?
You can search by name or use the filters for Family (Chart, Diagram, Geospatial, Plot, Table), Function (Comparison, Correlation, Distribution, etc.), Input, and Shape to narrow down options.
Is Data Viz Project free to use?
Yes, it is freely accessible online. Anyone can browse all 100+ visualization types and their examples without creating an account.
Who built Data Viz Project?
Ferdio, a data visualization agency, created and maintains the project. They also offer custom infographic and data visualization design services.
Is Data Viz Project free?
Yes — Data Viz Project is free to use. See the pricing section for any optional add-ons.
What platforms does Data Viz Project support?
Data Viz Project is available on: Web.